Lecture 3.3 - Hypothesis Testing
Hypothesis tests
- Hypotheses
- values
- The reasoning of hypothesis testing
- A hypothesis test for the mean
- Interval and tests
- values and decisions: what to tell about a hypothesis test
Hypotheses
King county

Percent of houses with a view
11% of houses in King County have a view
Put ourselves in the shoes of a a researcher – we only have a budget to drive around and sample 100 houses in a particular neighborhood
Does our sample represent the the idea that the neighborhood we chose to sample has a higher or lower percentage of houses with a view as compared to the overall county?
Hypotheses
- The starting hypothesis to be tested is call the null hypothesis – null because it assumes that nothing has changed.
- We denote it
- Called “H naught”
- : parameter = hypothesized value
- : has.a.view = 0.11
- The alternative hypothesis is not a single value, it contains all other values
- : parameter hypothesized value
- : has.a.view 0.11
How small to convince us?
- If the percent of houses with a view in our sample is 16%, we would be skeptical that there was any difference
- Not so unlikely to be different only by random chance
- If the percent of houses with a view is 31%, it would clearly indicate a change from 11%
- Extremely unlikely that this could happen just by random chance
- Can turn to confidence interval
- Standard deviation of the sampling distribution
Is the rate of houses with a view different?
- Idea: simulation
Is the rate of houses with a view different?
In 95% of samples of this size, percent of houses with a view is within 5% to 17% just by chance
In any given sample, should see between 5% and 17% of houses with a view
If we surveyed a neighborhood and actually saw 14%
Surprising?
Should we conclude that the percent of houses with a view in this neighborhood is different overall compared to King County?
CLT means we can use the Normal model
Central Limit Theorem: use Normal model to find probability instead of using a simulation
View rate of 0.14, 0.03 from null hypothesis, 0.11
Use the SD = 0.031 to find the area in the tails that lie more than 0.973 scores away from the null hypothesis
Indicates how rare observed rate is
Probability is 0.165 in each tail, or about 0.33 total that we would get an observation this far or father from the mean by chance
Conclusion
A difference in view percentages of houses of 0.03 or larger would happen about 33% of the time just by chance.
Does/Doesn’t seem very unusual.
- Both?
So observed proportion of 0.14 does/doesn’t provide evidence that this sample has a different percentage of houses with a view
- Borderline
A trial as a hypothesis test
Begin with the presumption of innocence ()
Collect evidence
- Bank money in house
- Still wearing mask
- Getaway car found in his name
Evidence beyond a reasonable doubt?
- Is 5% small enough chance?
- How about 1%?
- 6.7%?
A trial as a hypothesis test - decision
Beyond a reasonable doubt - ambiguous
Jury does not use probability to decide.
Null hypothesis - quantify exactly how surprising the evidence would be if the null hypothesis were true
How unlikely is unlikely?
1 out of 20, 5%, or 0.05
1 out of 100, 1%, or 0.01
You must judge for yourself in each situation whether the probability of observing your data is small enough to constitute “reasonable doubt.”
values
The value and surprise
The value is the probability of seeing data like these (or even more unlikely data) given the null hypothesis is true.
Tells us how surprised we would be to get these data given is true.
value is very low: Either is not true or something remarkable occurred. Reject .
value is high: Not a surprise. Data consistent with the model. Do not reject .
Guilty or not enough evidence?
- Defendant is either:
- Guilty: value too small. The evidence is clear.
- Not Guilty: value not small enough. The evidence is not sufficient. Not the same as innocent.
- May be innocent or may be guilty, but not enough evidence found.
- Two Choices
- Fail to reject if value large.
- Never accept .
- Reject if value is small. Accept .
- Fail to reject if value large.
When the value is not small
- It is wrong to say:
- Accept .
- We have proven .
- It is correct to say:
- Fail to reject
- There is insufficient evidence to reject .
- may or may not be true.
- Example: : All swans are white.
- If we sample 100 swans that are all white, there could still be a nonwhite swan.
The reasoning of a hypothesis test
Step 1: state the hypothesis
- :
- usually states that there’s nothing different.
- parameter = hypothesized value
- Note the parameter describes the population not the sample.
- is called the null hypothesis.
- :
- is a statement that something has changed, gotten bigger or smaller
- is called the alternative hypothesis.
Hypotheses about breakfast
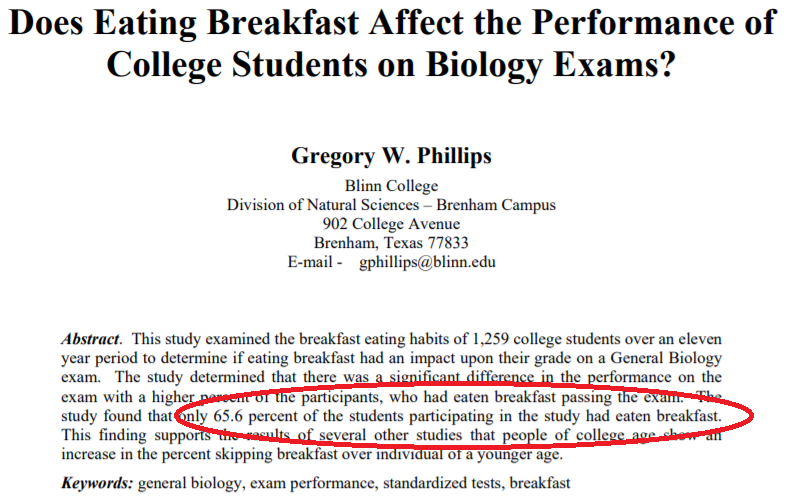
What would our hypotheses be if we did a study of DKU students and compared it to the percentage found in this paper (treat it as the population mean)?
Hypotheses about breakfast
Our data claims that 65.6% of students don’t eat breakfast.
In a survey of 26 students at DKU, 11 ate breakfast.
Is there evidence that breakfast rate is below 65.6%?
Step 2: the model
Decide on the model to test the null hypothesis and parameter.
Check conditions, e.g. independence, sample size.
If the conditions are not met, either quit or redesign the study.
Normal models use scores. Other models may not use scores.
Name the model, e.g. 1-proportion test.
Step 2a: 1-proportion test
Conditions: same as a 1-Proportion interval
Null hypothesis:
Test statistics
What conditions do we need to check to do a 1-proportion test?
Step 2b: checking conditions - eating breakfast
Randomization Condition: The 26 students were a random selection of DKU students
10% Condition: 26 is fewer than 10% of the total number of all students who are of interest.
Success/Failure Condition:
?
?
The conditions are satisfied. We can use the Normal model and perform a 1-Proportion z-Test.
Step 3: mechanics
- Claim: 65.6% students eat breakfast.
- 11 students in our class ate breakfast.
- Find value
- score of difference =
- Probability of seeing that large a difference: 1.2% of the time we will see a difference from the mean this large or larger
- 98.8% of the time we will see a difference this small or smaller.
- Note: values usually reported as “this large or larger”
What can we conclude from these results?
Step 4: conclusion
Is our sample different than the overall mean of students in the US? value = 0.012
What can be concluded? What does the value mean?
value = 0.012 Fail to Reject/Reject
The survey data does not provide strong evidence that the rate that DKU students eat breakfast is different than US average.
This should not be the end of the conversation.
The next step would be to see if the breakfast eating rate is lower for all classes/among freshman/sophomores/etc.
A hypothesis test for the mean
One sample test for the mean
Assumptions are the same.
Standard Error of
When the conditions are met and is true, the statistic follows the Student’s Model with df.
Use this model to find the value.
Interval and tests
Intervals and tests
- Confidence Intervals
- Start with data and find plausible values for the parameter. CI is data-centric.
- Always 2-sided
- Hypothesis Tests
- Using CI, is proposed parameter value consistent with interval? Test is model-centric.
- 2-sided test: Within the confidence interval means fail to reject .
- value = 1 – C is the cutoff.
The special case with proportions
- Confidence intervals
- Use to calculate
- Hypothesis Tests
- Use to calculate
If and are far from each other, the relationship between the confidence interval and the hypothesis test breaks down.
values and decisions: what to tell about a hypothesis test
How small a value is small enough?
How small is small enough is context specific.
Test to see if a renowned musicologist can distinguish between Mozart and Hayden.
- value of 0.1 may be good enough. Just reaffirming known talent.
A friend claims psychic abilities and can predict heads or tails.
- Very small value such as 0.01 needed. Breaking scientific theory.
Acceptable value depends on result’s importance
Proportion of students with full time jobs has increased.
- Not that important. value = 0.05 will work.
Testing the strength of a bridge based on a sample of concrete quality
- Life and death decision. Need a very small value
Whether rejecting or failing to reject, always cite the value.
An accompanying confidence interval helps also.
Recommendations from the American Statistical Association
- values can indicate how incompatible the data are with a specified statistical model.
- values do not measure the probability that the studied hypothesis is true, or the probability that the data were produced by random chance alone.
- Scientific conclusions and business or policy decisions should not be based only on whether a value passes a specific threshold.
- Proper inference requires full reporting and transparency.
- A value, or statistical significance, does not measure the size of an effect or the importance of a result.
- By itself, a value does not provide a good measure of evidence regarding a model or hypothesis.