Lecture 2.1 - Association and correlation
Association and correlation
Exercise 1
In your pairs, try to think of two variables that, in the real world, that might have this correlation for each of the following correlations. Try to think of a few examples for each correlation.
- 0.95
- 0.75
- 0.5
- 0.25
- 0.0
- -0.25
- -0.5
- -0.75
- -0.95
Pick a few of these and draw by hand what you expect these graphs to look like.
Exercise 2

Viewing an example relationship
- First, what is our expectation about the relationship between bedrooms and square feet?
- Direction?
- Form?
- Strength?
- Outliers?
Bedrooms and square feet - direction
A scatterplot is the easiest way to check for direction. In this case, the direction is obvious
Bedrooms and square feet - form
Bedrooms and square feet - strength
Correlation as a measure of strength
This correlation is a little weaker than perhaps what we expected
- In general, mechanically generated processes with little noise can have very high correlations
- Most correlations of social or real world processes rarely have above moderate correlation due to noise
Bedrooms and square feet - outlier
Again, we do not have a rule for selecting outliers other than to observe them on the scatterplot. In this case, there is one very obvious value far from other values
To investigate if this outlier matters, we can check some other values of the observation.
What kind of outlier do you think this is? Why?
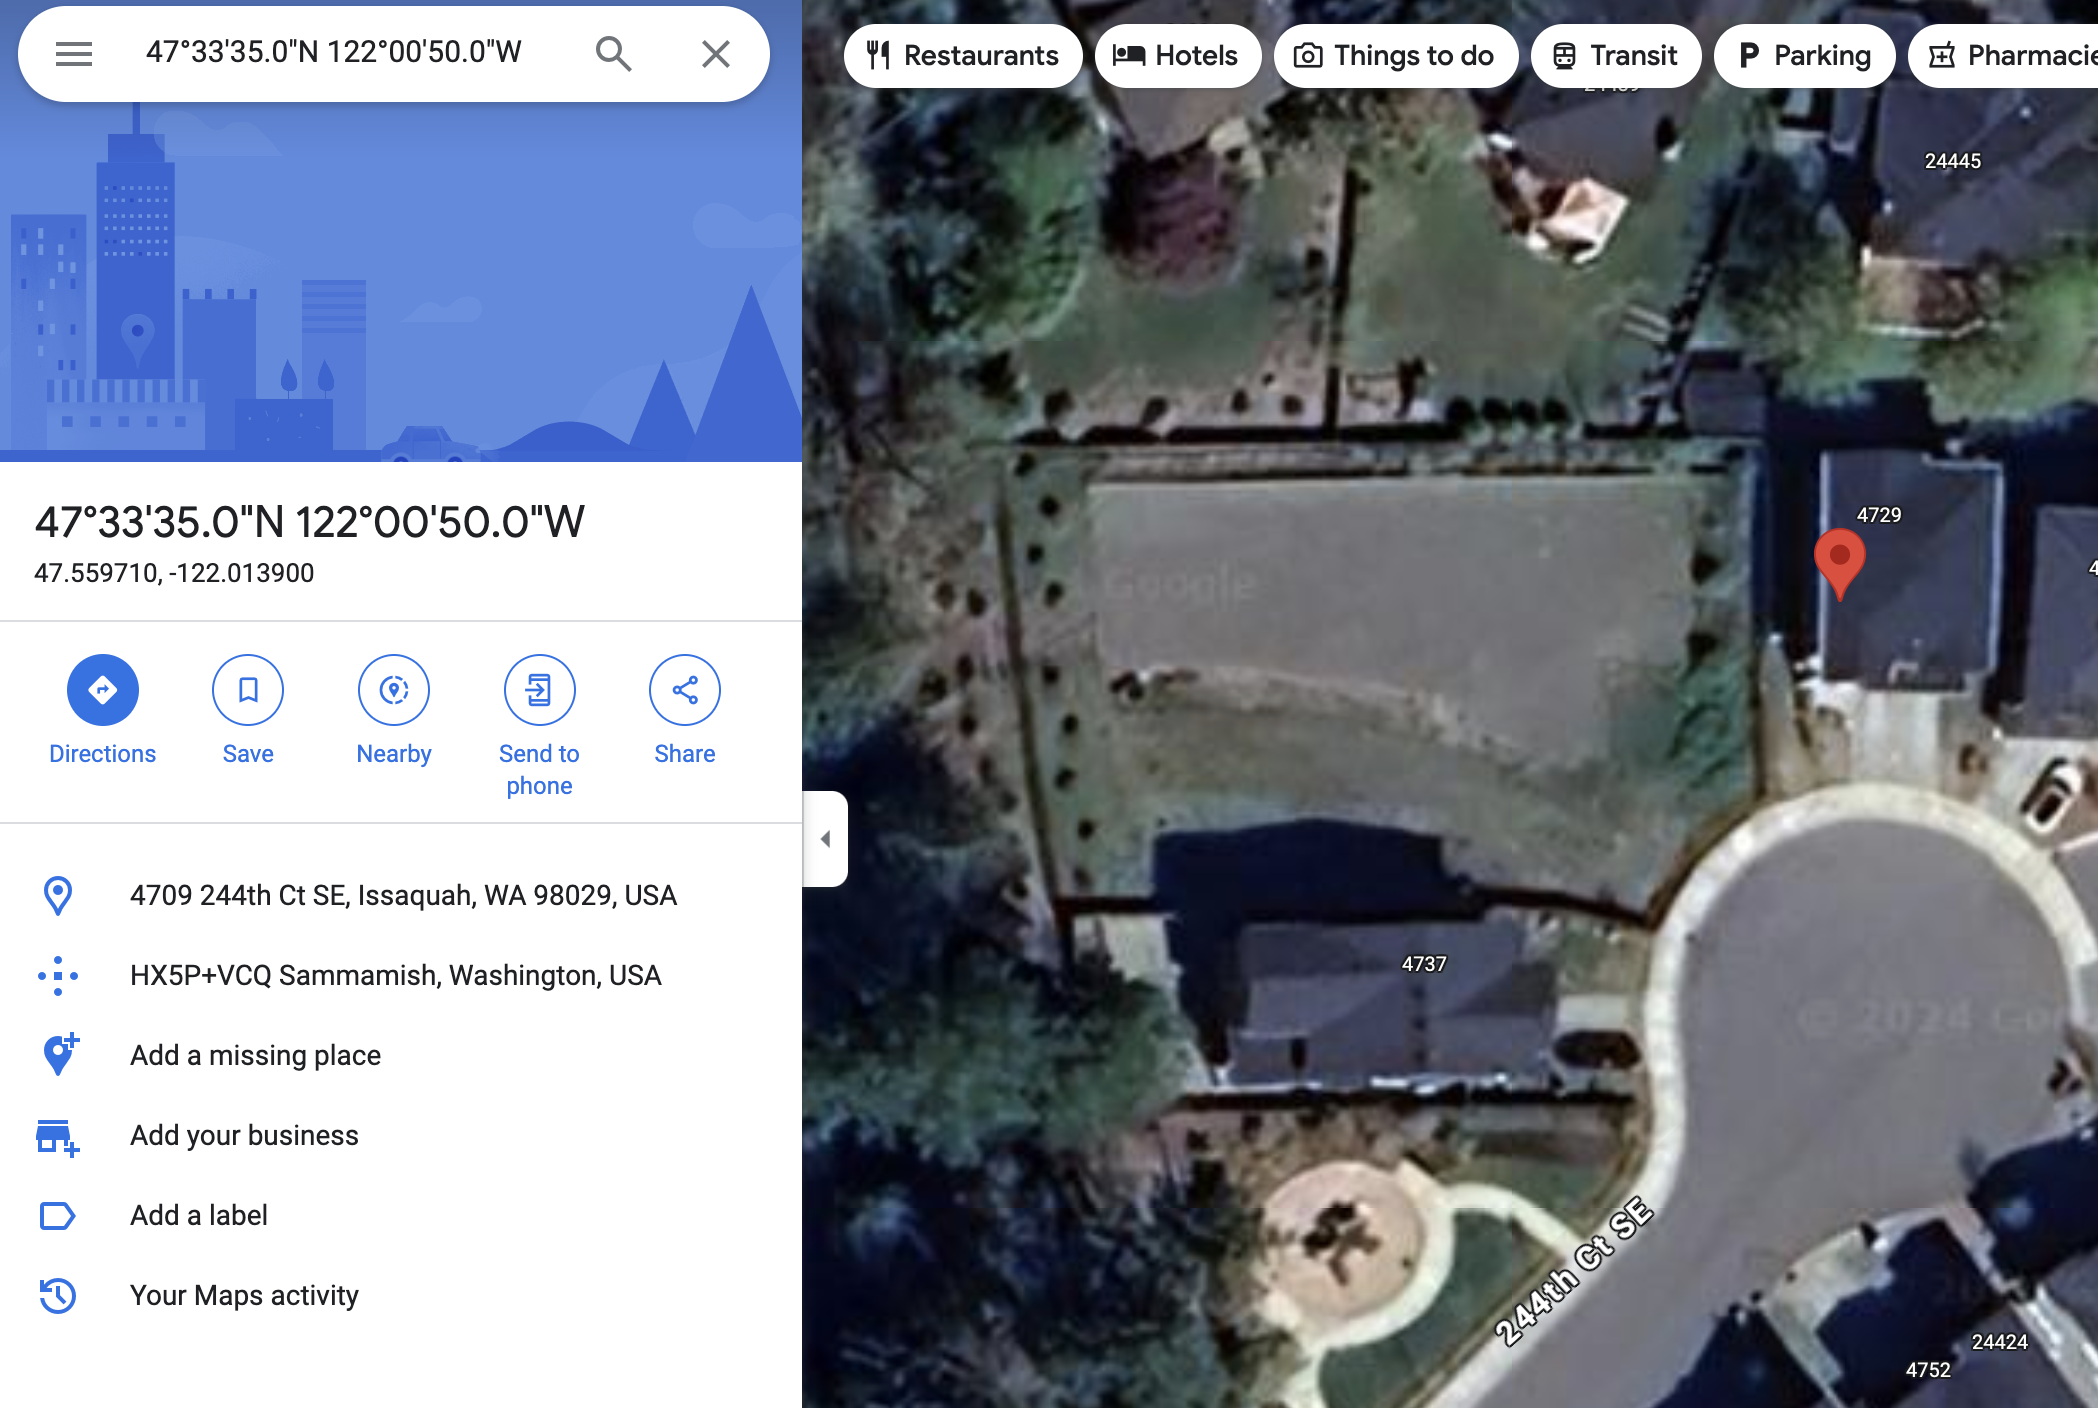
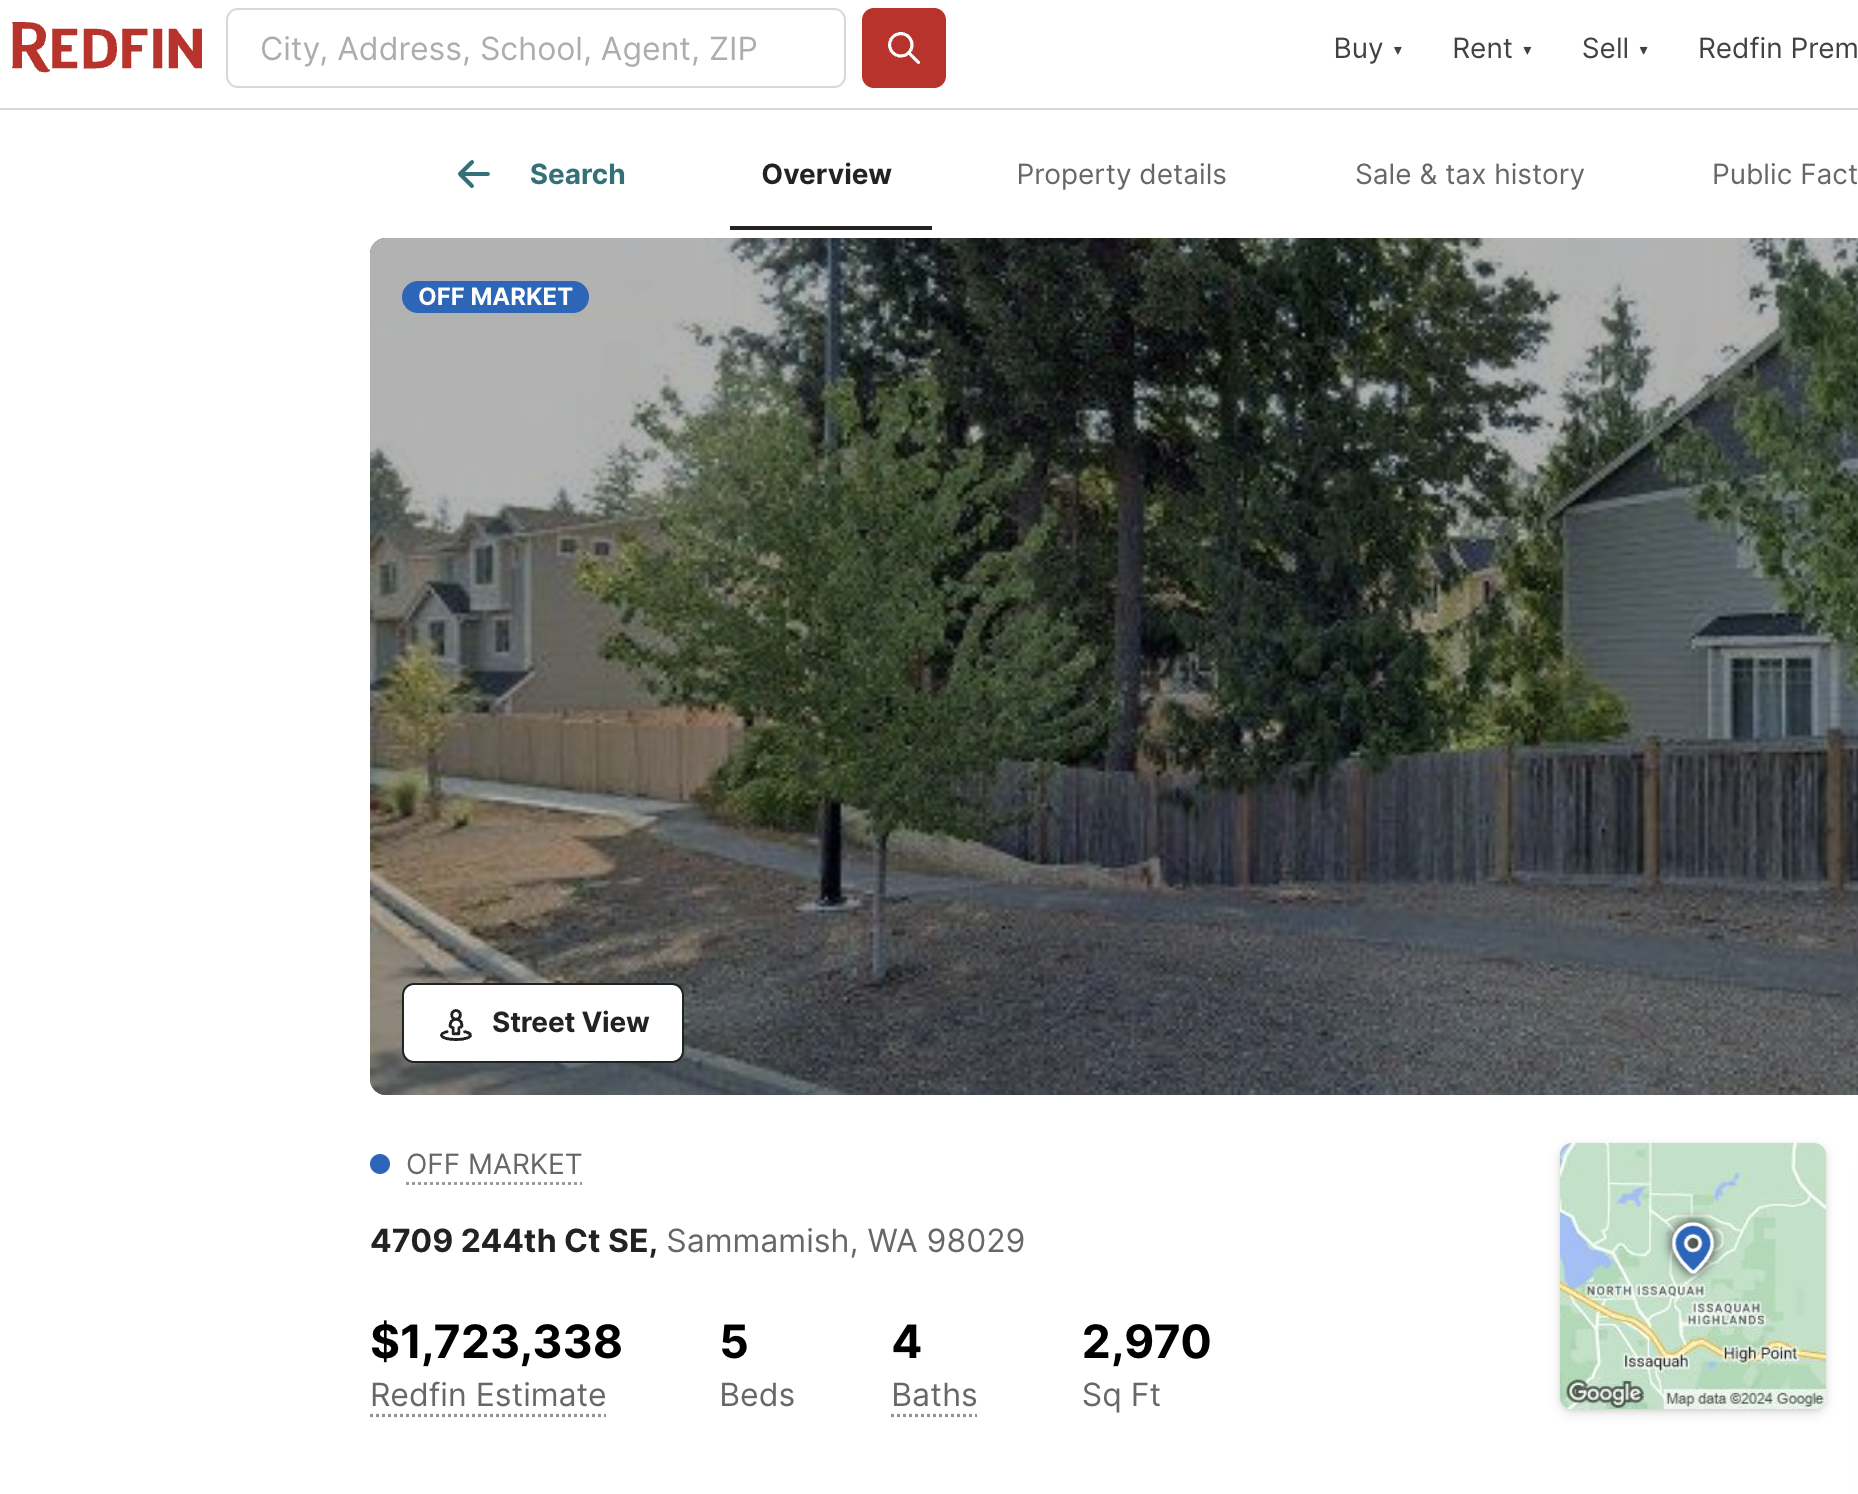
Outlier - actual observation
Data with no outlier
Describing the association
- Direction - positive
- Form - linear
- Strength - moderate/strong
- Outliers - one possible
Outlier:
Does bed and square feeet relationship match expectations?
- Seems to, more or less, the larger the house, the more bedrooms, so the relationship is positive
- The relationship is fairly linear, indicating a strong relationship
- Relationship is moderate
- Outliers don’t seem like it is a problem
However….
- What are some possible lurking variables that influence the relationship of bedrooms and bathrooms?
Relationship reexpressed?
One final issue to consider is if this relationship should be reexpressed - made more linear.
- Seems clearer
Your turn
With your partner, develop some expectations about some of the variables in the kc.houses dataset might be related.
Variables:
What to do with your partner:
- Write down an interesting question we think we might be able to answer by examining a relationship in this dataset
- Choose the variables that you think might be able to answer this question
- Write down what you expect the relationship to be between these two variables based on any prior knowledge
- Decide which variable is the response variable and which is the predictor variable
- Make a scatterplot using one of the codeblocks in the previous section and identify the features of the association